
The City of Burlington posts “Council Information” packages to the city’s website. These packages are available to the public on the city’s meeting calendar. (Council and Committees Calendar – City of Burlington)
The November 14th, 2025, package contains a list of questions and responses on the 2026 Budget.
One of the questions was: “How does the compounded inflation rate compare to the compounded overall property tax increase for the past few years?”
Not that it matters, but the Focus Burlington group didn’t ask this question. The question came from a councillor or through a councillor, on behalf of a member of the public.
Response:
“The City’s base budget incorporates the inflationary adjustments required to maintain the same level of municipal services as the previous year. As shown in the chart below, base budget increases have generally aligned with the prior year’s inflationary impacts, reflecting a catch-up of these costs.
In addition, the City continues to make increased investments in its capital program. These investments go beyond routine inflationary pressures, expanding the program, reducing the infrastructure funding deficit, and ensuring that municipal assets are maintained rather than allowed to deteriorate. While this funding represents a significant component of the tax increase, it remains well below the rising cost of construction.
During this period, the City has also enhanced—not just maintained—core service levels. Community feedback indicates a strong desire for improved services across several customer-facing areas. Recent budgets have therefore included substantial investments in Transit, Fire, Forestry, bylaw enforcement, and new community amenities.”
As part of the response, the city also provides this table:
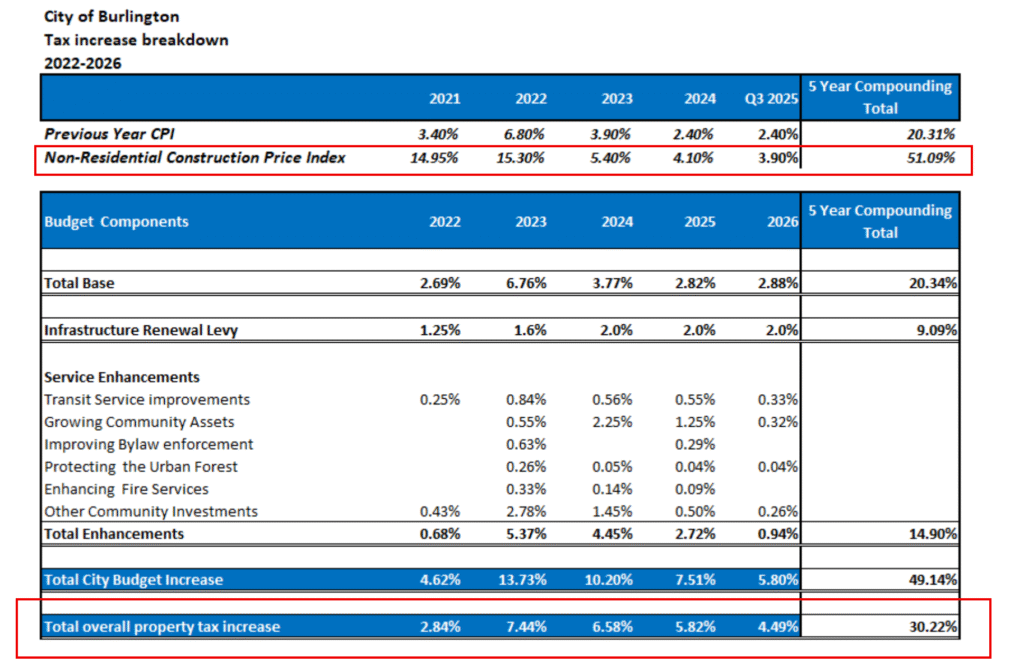
Non-Residential Construction Price Index
The Non-Residential Construction Price Index, 2021 to 2025, is shown as 51.09%.

The 2026 Budget states on page 33
“Non-residential building construction prices in Canada continue to rise, though more moderately than in the peak inflation years. On a year-over-year basis they rose about 3.5 %. Over the last decade, the Non-Residential Construction Price Index has risen about 22 % above general CPI levels, reflecting how labour and materials costs have outpaced consumer inflation. This places significant additional pressure on the capital budget.”
The budget tells us that over the last decade, non-residential construction prices increased by about 22% above inflation. The Bank of Canada inflation calculator puts inflation from 2015 to 2025 at 29.95%. According to the budget, non-residential construction inflation over the last 10 years is 51.95%.
In the city’s response to the question, they say non-residential construction inflation over the last 5 years is 51.09%.
What’s happened with property taxes since 2016?
The city’s Financial Information Returns (FIR), filed with the province, shows property tax revenue for 2016 as $148,396,695. The 2026 budget shows property tax revenue as $282,201,000.
That’s a 90% increase!
I guess we should all be happy the non-residential construction index only went up around 51%.
What’s happened with property taxes since 2021
The FIR for 2021 shows property tax revenue as $196,094,781. The 2026 budget shows property tax revenue as $282,201,000.
That’s a 52% increase!
I’m beginning to wonder if the increases in Burlington’s property taxes are somehow driving the increases in the construction index.
Does accuracy matter?
It’s only our tax bill and our money. Staff are answering, sorry, I mean, responding to a question put to them by an elected member of the council. Should the answer be correct or at least consistent with other documents provided by the city?
What about the “Total Overall Property Tax Increase”?
The question was “How does the compounded inflation rate compare to the compounded overall property tax increase for the past few years?”.

We’re talking about Burlington here, Burlington councillors, Burlington staff.
We can see that the total city budget increase compounds to 49.14%, whereas the tax increase compounds to 30.22%, which is higher than the compounded inflation rate.
In the same document, on page 8, the city provides this table:
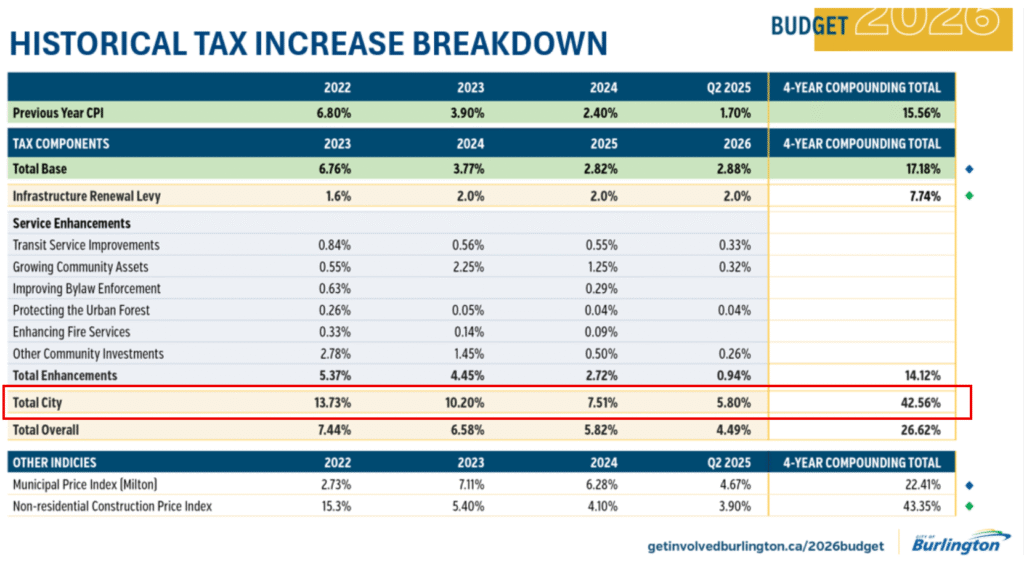
Here, in the “Historical Tax Increase Breakdown” we can clearly see the “Total City” increases in the red rectangle. The “Total City” increase, at least according to the city, compounded to 42.56%. There is an issue with the 2023 amount. Many people have checked their tax bills and can see the 2023 increase was 15.59%. The city claims the increase was 13.73%. We’ll use the city’s numbers for now.
Let’s go back to the original question for a minute: “How does the compounded inflation rate compare to the compounded overall property tax increase for the past few years?”
The city’s answer tries to show that inflation is 20.31% and taxes have increased 30.22%. The reality is that Burlington’s taxes, as shown on page 8, have increased by at least 42.56%. A rate that’s over twice the rate of inflation.
Do Burlington residents deserve transparency, accountability, and real engagement?
This post is part of a series.
Discover more from Focus Burlington
Subscribe to get the latest posts sent to your email.