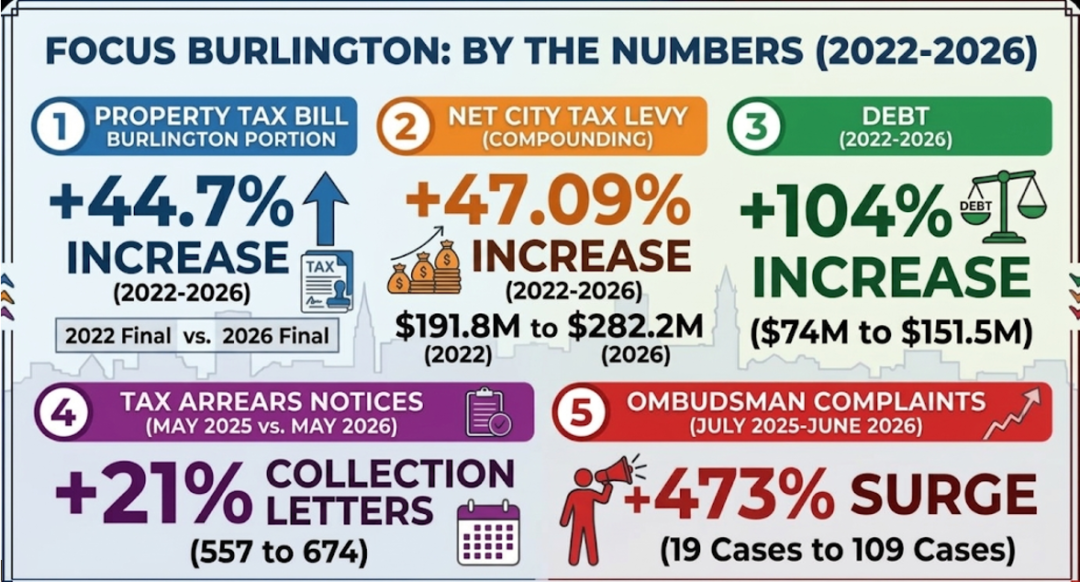
Burlington’s municipal election starts with internet voting from October 14th to October 23rd and ends with in-person voting on October 26th. Municipal elections take place every four years. Here are some key numbers showing how things have changed for Burlington over the last four years.
Property Taxes – Burlington’s portion of the tax bill – up 44.7%
Burlington Council is solely responsible for the Municipal Levy box on our tax bill. If you compare that box on your 2022 Final tax bill to your 2026 Final tax bill, it’s up 44.7%.
Net City Tax Levy – up 47.09%
A term for the total property tax revenue collected from homes and businesses in Burlington. If you rent a home, you pay taxes through your rent.
| 2022 | 2023 | 2024 | 2025 | 2026 | |
| Net City Tax Levy | $191,855,938 | $219,206,545 | $244,042,994 | $264,329,000 | $282,201,000 |
| Year-to-year | | 14.26% | 11.33% | 8.31% | 6.76% |
| CPI – Stats Canada | 6.80% | 3.90% | 2.4% | 2.10% | 3.00% |
| Compounding Increase % | 14.26% | 27.20% | 37.77% | 47.09% | |
| Compounding Increase $ | $27,350,607 | $52,187,056 | $72,473,062 | $90,345,062 |
Debt – up 104%
Debt rose from $74 million in 2022 to about $151.5 million in 2026. That’s up $77.5 million, or 104%. Servicing this debt is now costing taxpayers over $13 million a year.
Tax arrears – Collection letters are up 21% in one year.
In May 2026, 674 residential collection letters were issued, representing a 21% increase over the 557 letters issued in May 2025.
Penalties and interest charged on arrears for 2025: $1,991,294, up from $1,145,175 in 2022, a 74% increase.
| As at June 30 | 2022 | 2023 | 2024 | 2025 | 2026 |
| Percentage of tax bills outstanding | 30.9% | 32.8% | 32.7% | 33.2% | 33.4% |
City Managers in the last four years – 3 – Tim Commisso, Hassan Basit, Curt Benson.
109 Complaints to the provincial ombudsman from July 2025 to June 2026. Up from 19 in 2022-2023.
Full-time employees working for the city – up 15.51%; Population of the city – up 2.38%
| 2022 | 2023 | 2024 | 2025 | 2026 | Increase from 2022 | |
| Full-time employees | 1,038 | 1,089 | 1,148 | 1,184 | 1,199 | 15.51% |
| Population | 194,179 | 195,764 | 199,484 | 197,331 | 198,800 | 2.38% |
Professional Consulting Budget – up 113.21%
| 2022 | 2023 | 2024 | 2025 | 2026 | Increase from 2022 | |
| Professional Consulting | $684,945 | $908,868 | $1,120,175 | $1,354,720 | $1,460,385 | 113.21% |
Salaries, Wages and Benefits Costs – up 38.89%
| 2022 | 2023 | 2024 | 2025 | 2026 | |
| Budget: Salaries, Wages & Benefits Full & Part-Time | $138,399,244 | $156,520,953 | $169,676,663 | $181,476,000 | $192,225,000 |
| Year-over-year increase | 13.09% | 8.41% | 6.95% | 5.92% | |
| Compounding increase | 13.09% | 22.60% | 31.12% | 38.89% |
Projected City Budget and Municipal Levy increase for 2027 to 2031
| 2027 Low | 2027 High | 2028 | 2029 | 2030 | 2031 | |
| City Budget Increase | 5.00% | 7.30% | 5.51% | 5.14% | 4.92% | 4.56% |
Is it time for some new ideas at City Hall? Make a plan to vote in the October election.
Attend the Focus Burlington Mayoral Debate on October 1st. Tickets are free but please register here: https://www.eventbrite.ca/e/burlington-mayoral-candidates-debate-tickets-1998110191370
Discover more from Focus Burlington
Subscribe to get the latest posts sent to your email.